
Key Insights:
-
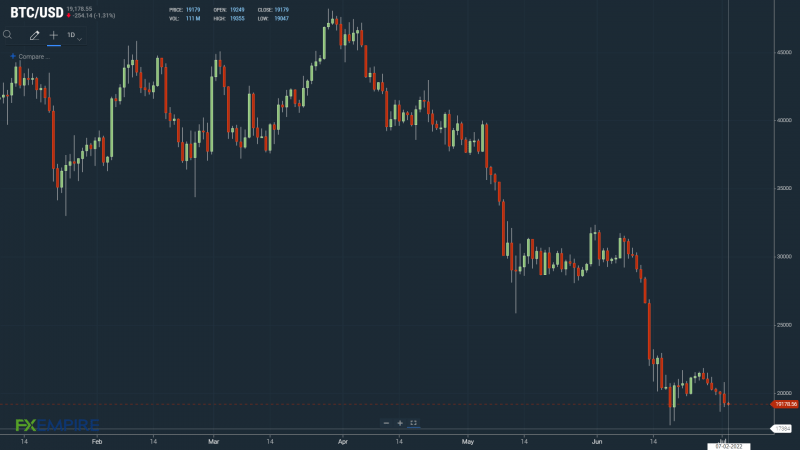
On Friday, bitcoin (BTC) slid by 3.31% to end the day at $19,249. It was a sixth consecutive day in the red, with the Fear & Greed Index bearish.
-
The downside came despite a late NASDAQ 100 relief rally, with bitcoin hitting reverse after the US market close.
-
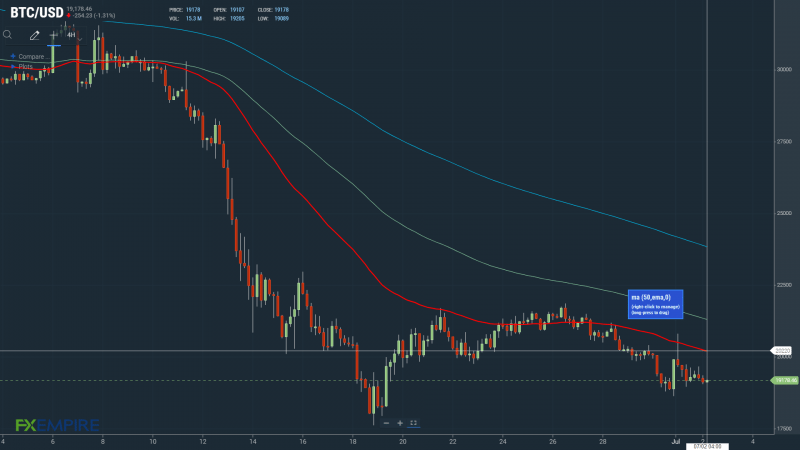
Technical indicators are bearish, with bitcoin below the 50-day EMA.
On Friday, bitcoin (BTC) slid by 3.31%. Following a 0.93% fall on Thursday, bitcoin ended the day at $19,249.
A bullish session saw BTC rally to an early high of $20,818 before hitting reverse.
BTC broke through the First Major Resistance Level at $20,493 before sliding to a late low of $18,952.
The extended sell-off saw BTC test support at the First Major Support Level at $18,974 before a partial recovery to $19,200 levels.
On Friday, the NASDAQ 100 found late support to end the day in positive territory. BTC tracked the NASDAQ through the day before a post-US market close reversal.

For the week, the NASDAQ slid by 4.13%, however, while bitcoin was down 8.48% Monday through Friday.
Crypto headwinds continued to weigh on investor appetite. An anticipated shift in the regulatory landscape, fears of a US recession, and sentiment towards central bank monetary policy remained market negatives.
Bitcoin Fear & Greed Index Continues to Send Bearish Signals
This morning, the Fear & Greed Index increased from 11/100 to 14/00. Bitcoin’s extended losing streak failed to send the Index to sub-10/100 going into the weekend.

While the upward trend would suggest improving market conditions, the Index has remained within a tight range since falling into the “Extreme Fear” zone.
A move beyond 14/100 and an upward trend towards 25/100 would signal a shift in investor sentiment.
The Index last visited the “Fear Zone” on May 5, when BTC stood at $36,630.
Bitcoin (BTC) Price Action
At the time of writing, BTC was down 0.36% to $19,179.
A mixed start to the day saw BTC rise to a high of $19,355 before falling to a low of $19,047.
BTC left the Major Support and Resistance Levels untested early on.
Technical Indicators
BTC will need to move through the $19,675 pivot to target the First Major Resistance Level at $20,396 and the Friday high of $20,818.
BTC would need plenty of support to break back through to $20,000.
An extended rally would test the Second Major Resistance Level at $21,535. The Third Major Resistance Level sits at $23,405.
Failure to move through the pivot would bring the First Major Support Level at $18,529 into play.
Barring another extended sell-off, BTC should avoid sub-$18,000 and the Second Major Support Level at $17,806.
The Third Major Support Level sits at $15,941.

Looking at the EMAs and the 4-hourly candlestick chart (below), it was a bearish signal. This morning, bitcoin sat below the 50-day EMA, currently at $20,220.
The 50-day EMA fell back from the 100-day EMA. The 100-day EMA eased back from the 100-day EMA, bitcoin price negative.
A move through the 50-day EMA would bring the Major Resistance Levels into play.
However, the Friday fall through the 50-day EMA does leave the Major Support Levels in play.
This article was originally posted on FX Empire
More From FXEMPIRE:
,,,